Less is more: I had a lot of memory crashes on my application

Hakanai has been in production since mid-May. Everything was going well and then, all of a sudden, 2 weeks ago I started having problems with the application crashing.
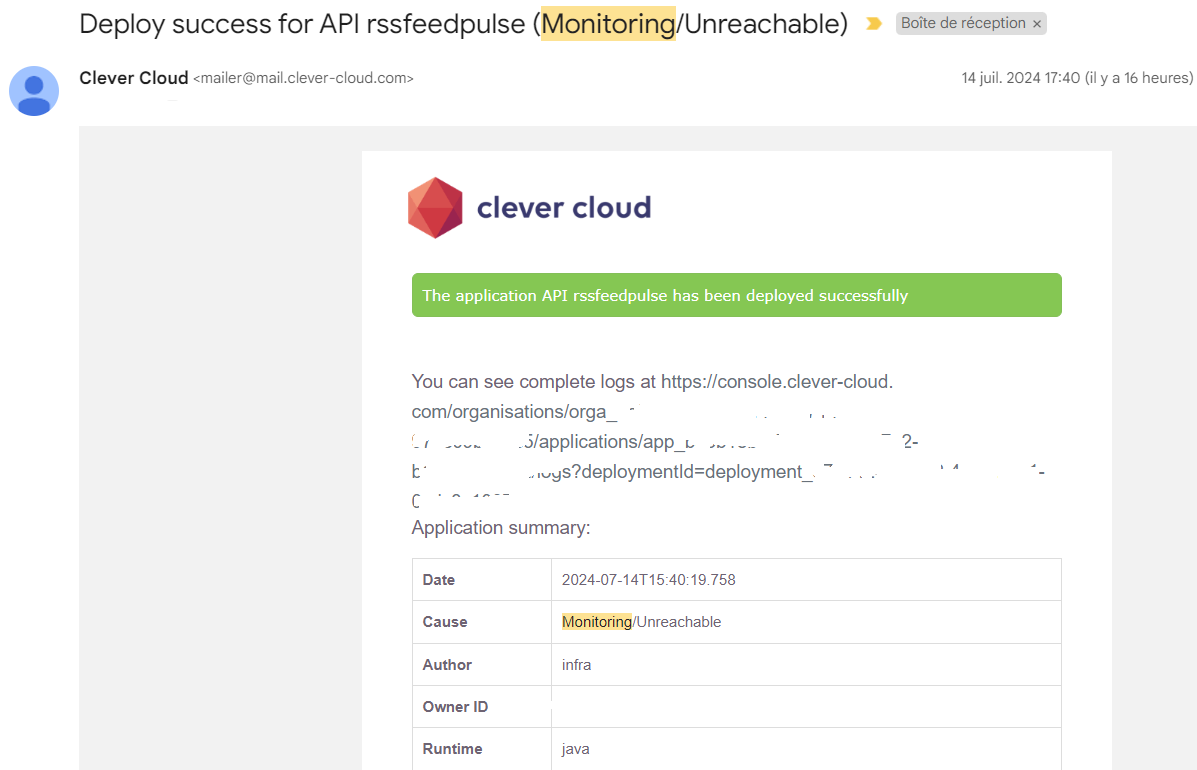
This is the email I used to receive. Several times a day, I'd get an email from my PAAS host telling me that the application had been restarted.
Except that 2 weeks ago, I didn't do much. So what happened?
Logs
The first thing you look at when an application crashes is the logs. What was my application doing before it crashed, and are there any visible errors?
Well, unpleasant surprise, nothing at all. The application was doing nothing. The logs are virtually empty. There's never any correlation between a log and a restart.
In fact, you can't really call it a crash. The application was restarted, but without any error on my part.
The Hakanai API is far from overloaded. There are few clients, so little processing.
In short, no logs to understand...
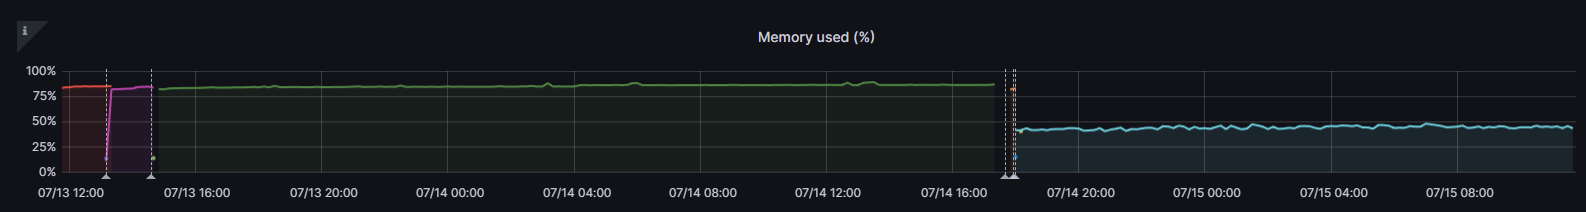
On the other hand, Clever Cloud offers to visualize metrics on Grafana, and we see this:
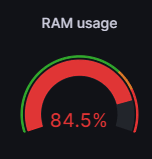
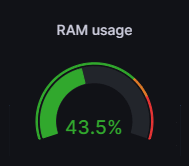
Memory too high?!
84% memory usage?! That's just not right. And eventually, it may explain some reboots.
Many PAASs look at the resources used by an application and restart the application if it uses too many.
So my hypothesis was simple. I'm using too much memory, and at some point Clever Cloud decides it's no longer possible.
Except, the support team told me this wasn't the case:
Monitoring checks whether the application accepts connections on port 8080. When this isn't the case, it means that the application isn't responding at all.
In spite of everything, I wanted to continue down this path. Because I've got 1GB of ram on this machine. And given what it does, it's not possible to use 84% of that RAM.
When I see an anomaly like that, I like to understand. Sometimes it can be a side-effect of a more serious problem, or conversely, it can create unsuspected side-effects (like reboots).
But at this stage, I don't see any problem with the application itself.
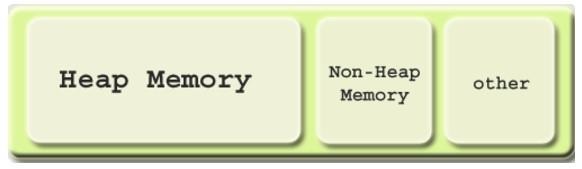
And another piece of information given by clever cloud seemed to me to point in that direction:

The heap used would "only" be 60Mb. That's not surprising, given the current application, and it's a long way from occupying 84% of the machine's memory.
Java's memory model
I won't go into detail here, but it's important to have a basic understanding of how a JVM works.
Java is often criticized for its very high memory consumption (and startup time, but that's not the point here).
And let's face it, you can get into a lot of trouble very quickly with a JVM.
When you launch a Java application, it runs inside a JVM, which interprets a semi-compiled code file (the byte code) and compiles it on the fly into machine language.
A JVM requires a certain amount of memory at startup.
Part of this memory is called the Heap. It's used to store all your application's dynamic allocations. You create a variable, and off it goes into the Heap. And the memory is freed automatically when the variable is no longer in use.
For performance reasons, the JVM takes a certain amount of memory from the system at start-up, even if it's not being used. Because otherwise it would be too expensive to constantly allocate and return memory to the system.
So it's possible for the JVM to take up 1GB of memory on a machine, even though the Heap used is "only" 50MB.
This is a bit counter-productive, which is why you can set the minimum and maximum Heap size with the -Xmx and -Xms options.
One solution would have been to take a more powerful machine on Clever Cloud. But it would still be rather ridiculous (and expensive) to take 2GB of ram for an application that probably consumes less than 100MB the majority of the time.
And I know from experience that very often, to solve problems of over-consumption in Java, it's better to lower the Heap rather than increase it.
(Yes, because it's not very efficient either to have a very large Heap in which you constantly have to allocate, deallocate, inspect etc...).
Anyway, what if I reduced the size of this JVM?
Call a friend
My first instinct was to overload environment variables on Clever Cloud to reduce the Heap used.
So I used the -Xmx option to use "only" 512MB of Heap.
And yet...
The result wasn't exactly convincing. So I called Clever Cloud support team to find out.
Clever Cloud support team is one of this provider's good points. I have other reservations about the PAAS itself, but good support is a very valuable asset.
It was reactive (quick response), proactive (the person took the initiative to test things without my asking) and, on the face of it, efficient.
Two elements stood out:
- the option I was using to modify the Xmx wasn't working and I had to use another option on Clever Cloud
- my application launch script wasn't right...
Yes, I told you earlier that I didn't suspect my application at all.
I was a little mistaken. It's true that the application itself doesn't seem to contain any problems. However, I was using this command to start it up:
mvn spring-boot:run -Pnative -Dspring-boot.run.profiles=native
And this is ....
Running an application with maven is not at all optimal. It's made for dev. It has the enormous advantage of monitoring the source code for changes and reloading them on the fly, so there's all this extra machinery, which creates overhead, that's of no use in production.
Both comments have been taken into account. And now :
Above all, no restarts since this modification.
Unanswered questions
All's well that ends well?
Partially, yes.
- The application consumes less. I could even have gone down to 384MB given the actual consumption.
- no more restarts
There are still some unresolved issues.
- Why don't I get any logs before restarts?
- Why did it start 2 weeks ago?
- Why did the machine load and CPU consumption increase before the crashes?
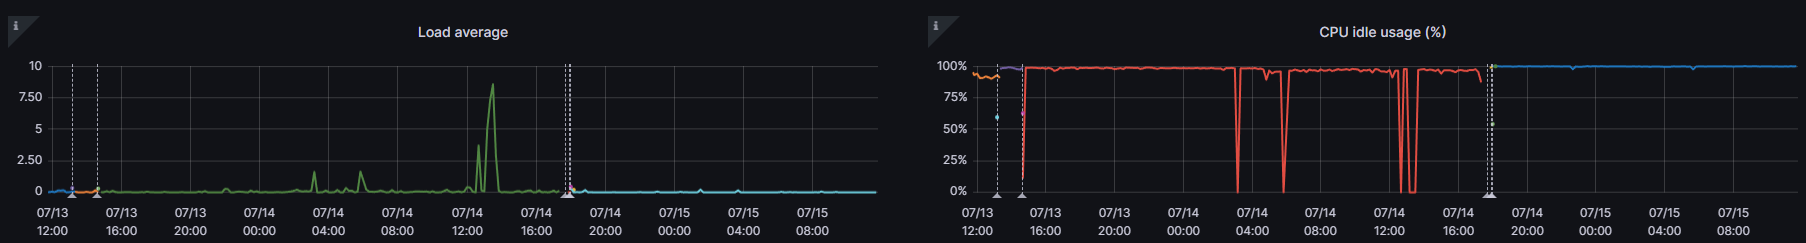
Okay, the JVM was taking up 84% of the machine's RAM. But so what?
Could this be due to internal JVM operations, which were attempting to inspect the HEAP, make memory allocations or whatever?
That's my main hypothesis, but I'm not sure.
In any case, I'm back on Hakanai with peace of mind. And that's nice.